Mental Health in Tech
Implementation of Replicated SeeDB for Smart Recommendation of Visualizations
Python, PostgreSQL, Psycopg2This project is the implementation of the replicated SeeDB to visualize and extract knowledge from the 'Mental Health in Tech' dataset. It includes Exploratory Data Analysis and various pruning techniques for optimization.
The 'Mental Health in Tech' dataset is a survey dataset that can be used to assess the mental health of people working in the technological industry. The dataset has been obtained from
Kaggle and originally contains 27 features and 1259 data points. It contains attributes/questions like:
* Age
* Gender
* Country
* State (US), Are you self-employed?
* Do you have history of mental illness?
* Have you sought
treatment for a mental health condition?
* Do you work remotely?
A sample of 5 datapoints is given below. The table has 5 rows and 27 columns.
| Timestamp | Age | Gender | Country | state | self_employed | family_history | treatment | work_interfere | no_employees | remote_work | tech_company | benefits | care_options | wellness_program | seek_help | anonymity | leave | mental_health_consequence | phys_health_consequence | coworkers | supervisor | mental_health_interview | phys_health_interview | mental_vs_physical | obs_consequence | comments | |
|---|---|---|---|---|---|---|---|---|---|---|---|---|---|---|---|---|---|---|---|---|---|---|---|---|---|---|---|
| 0 | 2014-08-27 11:29:31 | 37 | Female | United States | IL | NaN | No | Yes | Often | 6-25 | No | Yes | Yes | Not sure | No | Yes | Yes | Somewhat easy | No | No | Some of them | Yes | No | Maybe | Yes | No | NaN |
| 1 | 2014-08-27 11:29:37 | 44 | M | United States | IN | NaN | No | No | Rarely | More than 1000 | No | No | Don't know | No | Don't know | Don't know | Don't know | Don't know | Maybe | No | No | No | No | No | Don't know | No | NaN |
| 2 | 2014-08-27 11:29:44 | 32 | Male | Canada | NaN | NaN | No | No | Rarely | 6-25 | No | Yes | No | No | No | No | Don't know | Somewhat difficult | No | No | Yes | Yes | Yes | Yes | No | No | NaN |
| 3 | 2014-08-27 11:29:46 | 31 | Male | United Kingdom | NaN | NaN | Yes | Yes | Often | 26-100 | No | Yes | No | Yes | No | No | No | Somewhat difficult | Yes | Yes | Some of them | No | Maybe | Maybe | No | Yes | NaN |
| 4 | 2014-08-27 11:30:22 | 31 | Male | United States | TX | NaN | No | No | Never | 100-500 | Yes | Yes | Yes | No | Don't know | Don't know | Don't know | Don't know | No | No | Some of them | Yes | Yes | Yes | Don't know | No | NaN |
The answers to these questions give us a feel about the possible mental health condition of the people working in the tech industry. It can also be utilized to answer some thought-provoking questions
like:
* How does the frequency of mental health illness vary by geographic location?
* What are the strongest predictors of mental health illness in the workplace?
* How does the attitudes towards mental health vary by geographic location?
* What are the strongest predictors of certain attitudes towards mental health in the workplace?
Four sets of target-reference view queries have been implemented, that is, [self_employed, not_self_employed], [family_history, no_family_history], [treatment, no_treatment] and [remote_work, no_remote_work]. Therefore, a total of 4*2 = 8 tables were generated, and four sets of values were defined for Dimension Attributes A. The top-3 recommendations for the visualizations on this dataset are:
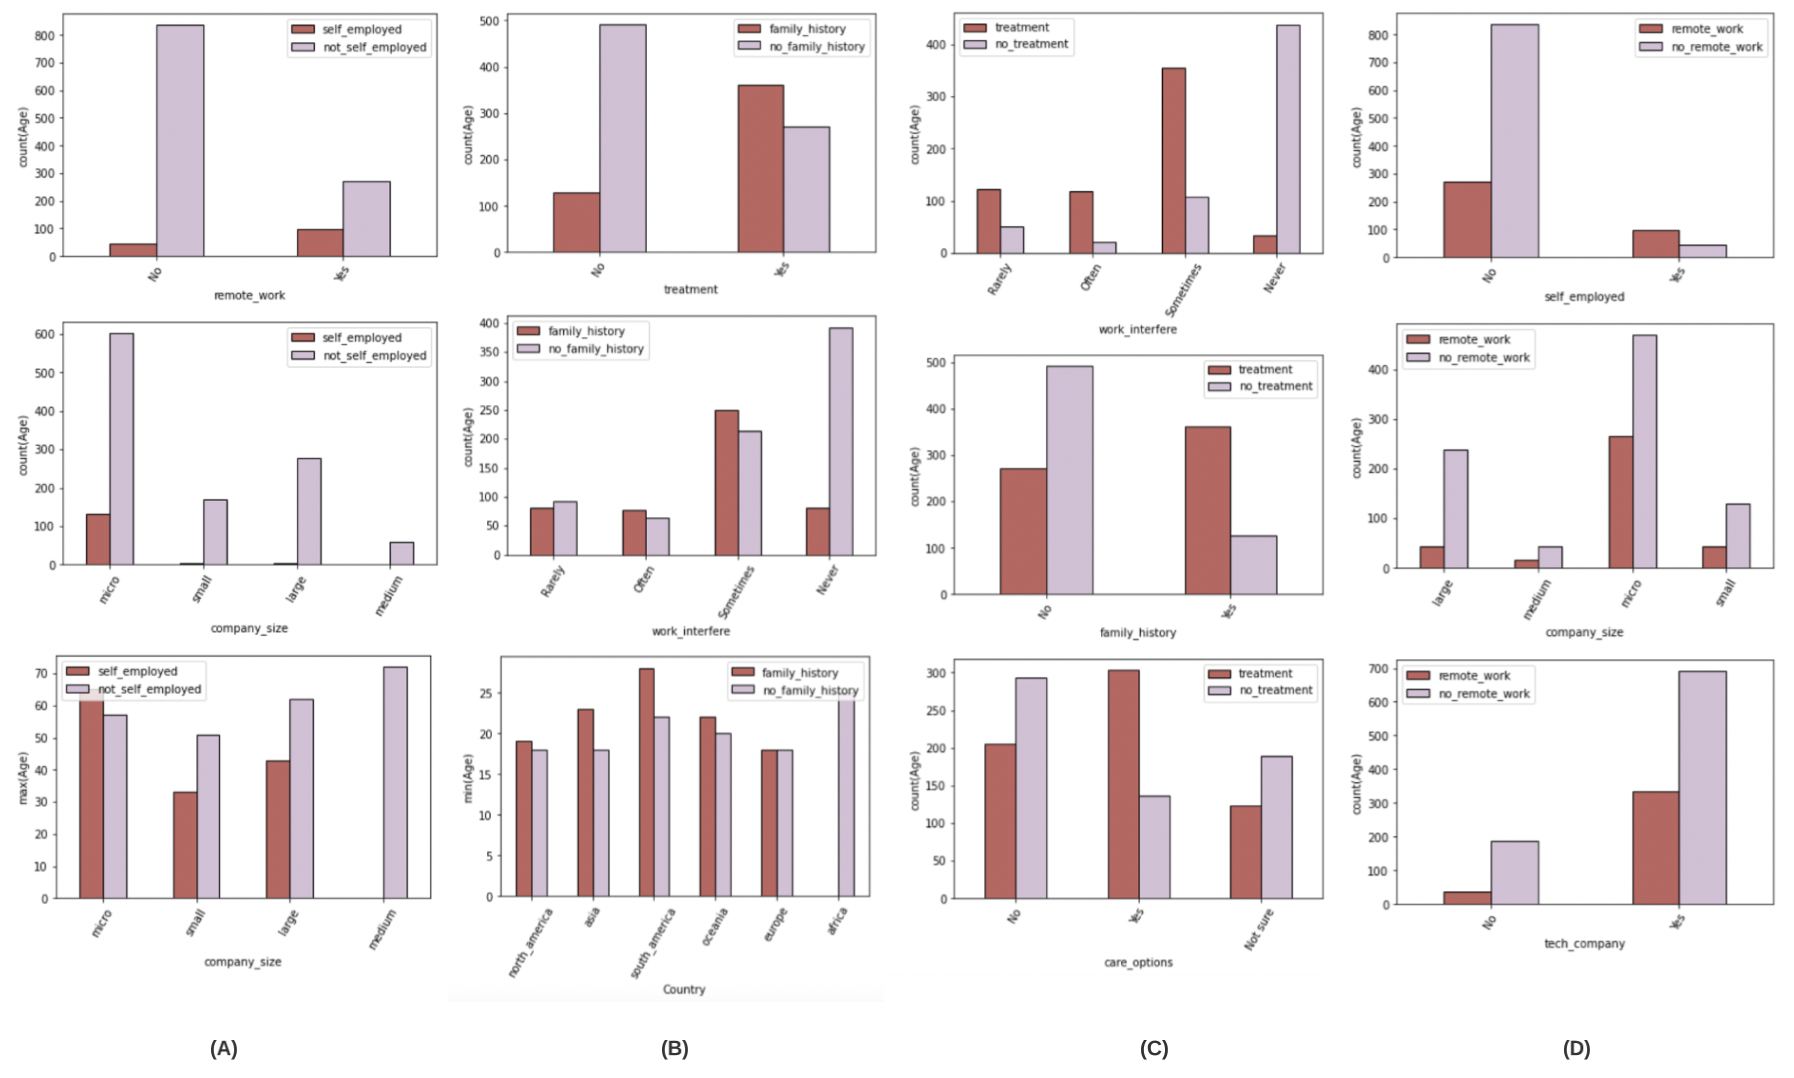
The figure (A) shows the top-3 recommended visualizations for [self_employed, not_self_employed], (B) shows for [family_history, no_family_history], (C) for [treatment, no_treatment], and (D) for [remote_work, no_remote_work]. Read more on my GitHub.